Reading time: 8 minutes
Introduction
With the ever-growing increase in mobile phone usage, it has become more important to increase the battery life of the devices to ensure user satisfaction. A large part of the battery consumption and network usage of these devices comes from video streaming applications. Some of the most popular being from Netflix, YouTube, Amazon Prime Video and Twitch for video streaming applications. Reducing energy usage and network usage of video and streaming applications is a major point of emphasis in the mobile world and is vital for both consumers and developers. When looking at this trend from the standpoint of battery life, mobile platforms must conserve resources to improve the battery performance and user experience.
We advise developers on how to make users aware to consume a stream with lesser quality, or we advise developers to put the default settings in a so-called battery saving mode. To reduce the battery life of the device one can simply choose to consume the stream with a lower quality. The benefit of this is that the battery life of the device will be saved and less internet data is consumed. However, a trade-off is that the quality of the stream is poor and this can affect the user experience. A hybrid solution could be provided which selects the best available quality based on battery level. The reason why we chose to focus on the developer and the user is that the developer wants a user to consume the application as long as possible since the payment model in most of streaming apps are advertisement based and thus it is self-explanatory that the longer the user will stream the more the developer will have profit. In addition a user benefits from energy conservation by streaming longer and paying less for the energy bills in the long term. Moreover the user will benefit from reducing network usage and thus pay less monthly bills to the internet service provider.
Results
In our experiment we have two applications - YouTube and Twitch. These two mobile applications use similar streaming technology. However, integrated and complicated applications like this would contain lots of API indicators and third-party services. We separate them into different blocks and make no comparison between them. Below are the summary statistics for each block.
YouTube
We choose YouTube as the mobile application. The experiment estimates the power consumption and network packages during the video plays. We set different qualities, which are provided in YouTube (360p, 480p, 720p 1080p).
- Energy Consumption (Joules) - YouTube
| YouTube | 360p | 480p | 720p | 1080p |
|---|---|---|---|---|
| Min | 736 | 879 | 1154 | 1972 |
| 1st Qu. | 852 | 892 | 1293 | 3013 |
| Median | 879 | 990 | 1352 | 3246 |
| Mean | 880 | 978 | 1341 | 3079 |
| 3rd Qu. | 921 | 1010 | 1393 | 3393 |
| Max | 967 | 1053 | 1498 | 3556 |
| St.deviation | 53 | 45 | 95 | 474 |
We can see from this table that the minimums and the maximums are increasing with the quality.
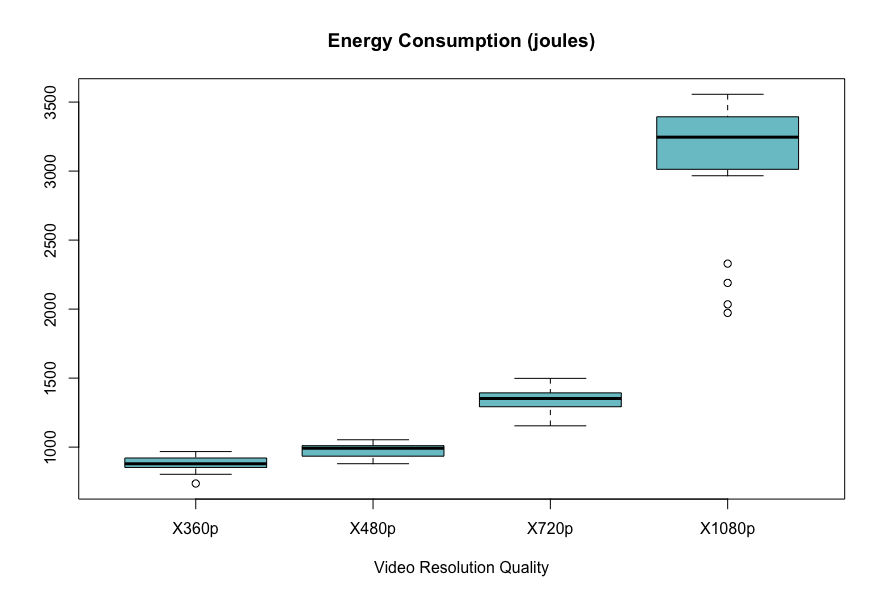 To better visualize this trend, we create the box plots.
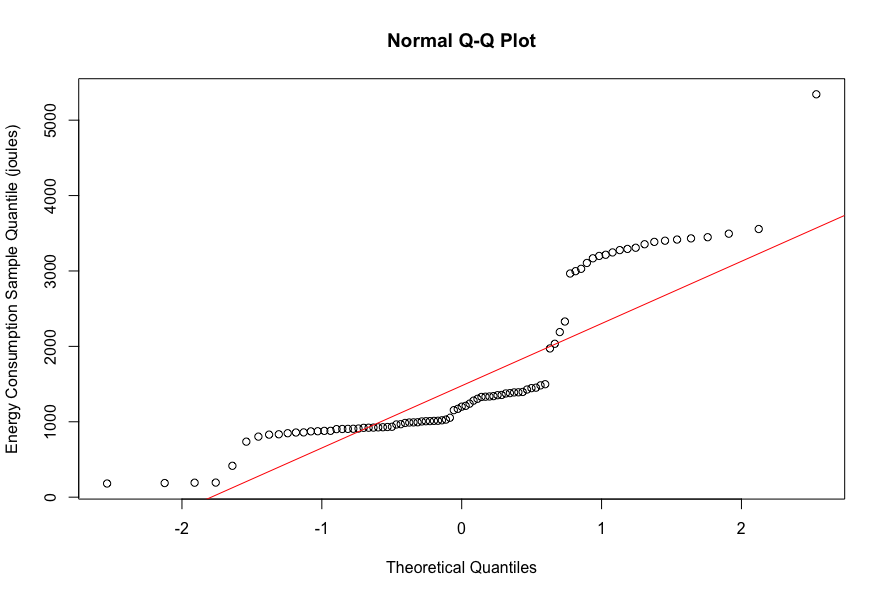
According to the Q-Q plot, we can observe that most of the values are not following the straight line, so the data-set is not normally distributed.
We also use the Shapiro-Wilk test to check the normality. The p-value is 2.254e-09, which is less than 0.05, hence we reject the distribution hypothesis and accept that the data is not normally distributed.
- Network traffic (Packets Size) - YouTube
As we mentioned, the third-party services and other API indicators during the video playback is tricky to follow. Hence, the filter in our network capturing tool does not specify the destination or source as YouTube. This filter will capture all the relative packages, including the third-party data. Otherwise it would make our transferred packets much larger than usual. We decide to perform the data reduction by reducing the packages when not using YouTube. The reduction’s amount, called idle packets, is the transferred packets when the phone is idle.
Our metrics for the network traffic are the number and size of packets during video playback. The number of transferred packets is closed to each other under different quality settings, around 145,000. However, the size of the network packets varies for different quality settings. Moreover, there is a clear trend in the data: with higher quality settings, the larger network packets are being transferred during the video playback.
| YouTube | 360p | 480p | 720p | 1080p |
|---|---|---|---|---|
| Min | 736 | 879 | 1154 | 1972 |
| 1st Qu. | 852 | 892 | 1293 | 3013 |
| Median | 879 | 990 | 1352 | 3246 |
| Mean | 880 | 978 | 1341 | 3079 |
| 3rd Qu. | 921 | 1010 | 1393 | 3393 |
| Max | 967 | 1053 | 1498 | 3556 |
| St.deviation | 53 | 45 | 95 | 474 |
The table illustrates the packets size during the video plays under different quality settings in YouTube.
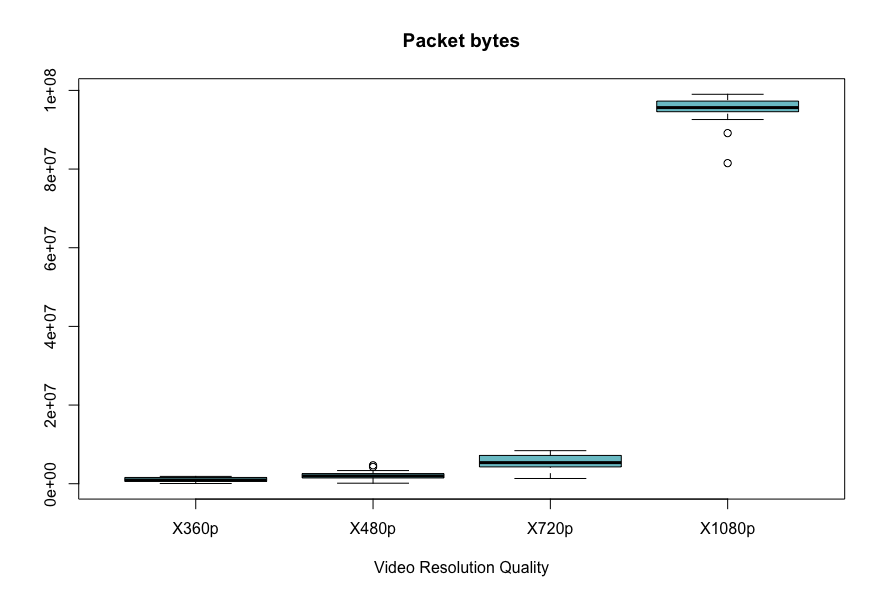
A similar trend shows in the network traffic that increasing the quality of the videos will increase the network traffic.
We also use the Shapiro-Wilk test to check the normality. The p-value is 3.428e-09, which is less than 0.05, hence we reject the distribution hypothesis and accept that the data is not normally distributed.
Twitch
For Block two, we choose Twitch as the mobile application. The same experimental design as block one will be applied since we separate these two applications for different features. The features will influence the results of the experiments but not the processes. Twitch also provide the quality settings as 360p, 480p, 720p and 1080p.
- Energy Consumption (Joules) - Twitch
| Twitch | 360p | 480p | 720p | 1080p |
|---|---|---|---|---|
| Min | 1274 | 1801 | 2329 | 6066 |
| 1st Qu. | 1362 | 2053 | 2865 | 7199 |
| Median | 1435 | 2142 | 3004 | 7513 |
| Mean | 1420 | 2140 | 2949 | 7878 |
| 3rd Qu. | 1485 | 2247 | 3070 | 9210 |
| Max | 1515 | 2420 | 3292 | 9849 |
| St.deviation | 74 | 167 | 247 | 1257 |
We apply the same plots as block one since the similar methodology fits for both applications. The table illustrates the energy consumption under different quality settings in Twitch.
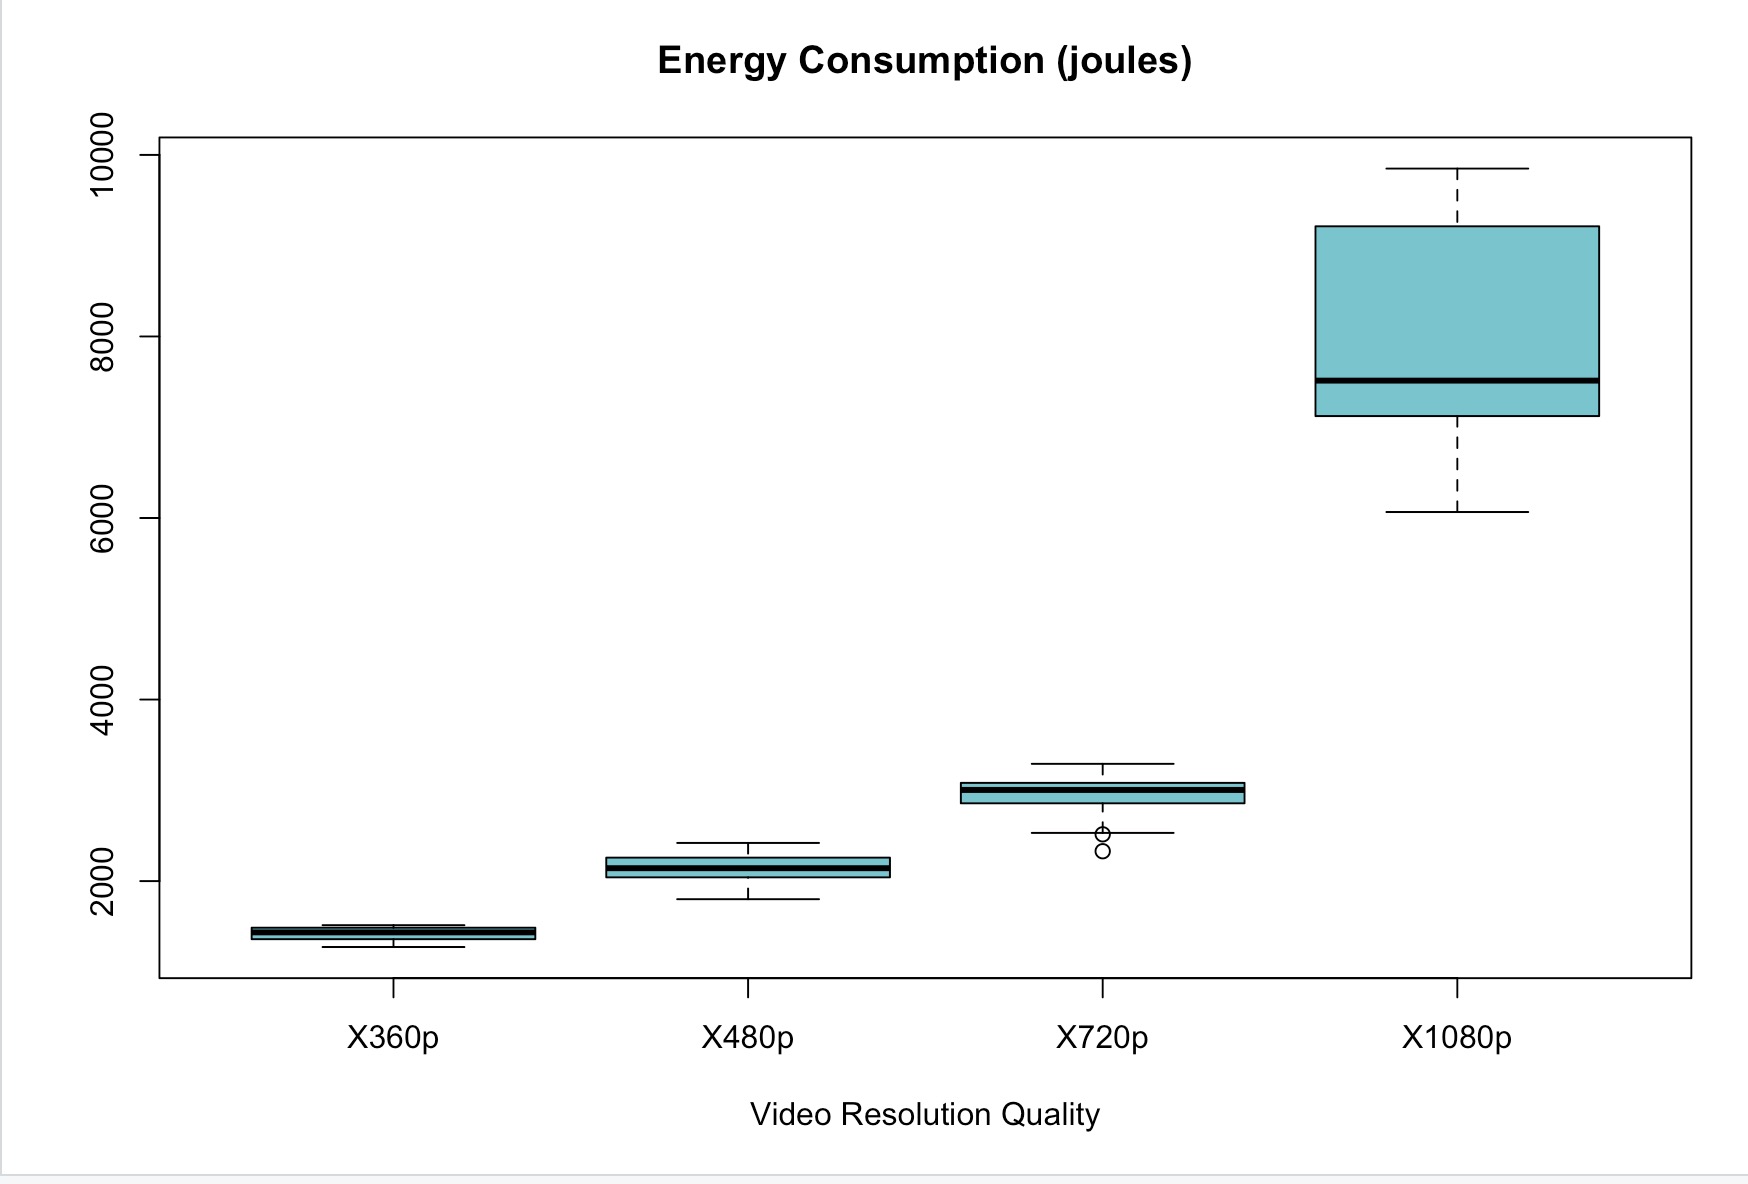 The figure shows the box plots of the energy consumption of the Twitch app.
We also can see from this table that the minimums and the maximums are increasing with the quality. So we create the box plots to better visualize this trend.
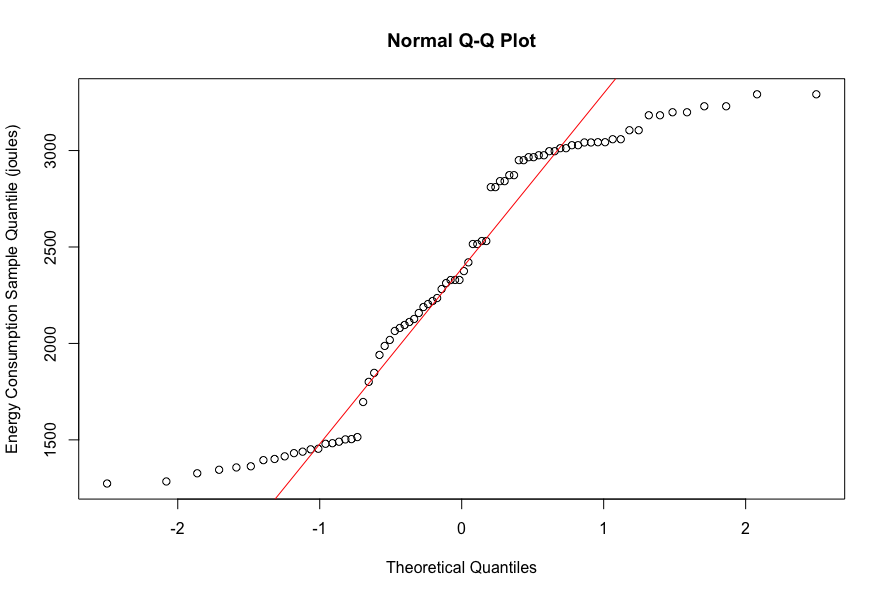
From the Figure, we can see that the dataset is not normally distributed.
We also use the Shapiro-Wilk test to check the normality. The p-value is 7.474e-06, which is less than 0.05, hence we reject the null hypothesis and accept that the data is not normally distributed.
- Network traffic (Packets Size) - Twitch
The following table illustrates the packets size during the video plays under different quality settings in Twitch.
| Twitch | 360p | 480p | 720p | 1080p |
|---|---|---|---|---|
| Min | 736 | 879 | 1154 | 1972 |
| 1st Qu. | 852 | 892 | 1293 | 3013 |
| Median | 879 | 990 | 1352 | 3246 |
| Mean | 880 | 978 | 1341 | 3079 |
| 3rd Qu. | 921 | 1010 | 1393 | 3393 |
| Max | 967 | 1053 | 1498 | 3556 |
| St.deviation | 53 | 45 | 95 | 474 |
Network traffic in Twitch is quite similar. And to avoid redundancy, we will focus on the trend we observed in this experiment. The increasing trend of network traffic with the quality settings is evident. Each dataset with different streaming qualities is distinct from others. There is no data overlap between these datasets.
We also use the Shapiro-Wilk test to check the normality. The p-value is 2.576e-09, which is less than 0.05, hence we reject the distribution hypothesis and accept that the data are not normally distributed.
Noises and Outliers:
There are some noises and outliers in our experimental data. For the extreme noise such as non-positive packets’ number or size and non-positive energy consumption, we cut off these data for data cleansing. These data are collected incorrectly in the procedures, probably in AndroidRunner or WireShark. And for some outliers like low consumption and low network traffics in a 1080p quality setting, we keep this for these two reasons. First, the data can be correct since some video playback can be short and do not have any advertisements. Second, the data plays a crucial role in statistics analysis for rejecting the null hypothesis. We can not remove them because they might suggest no impact on the consumption or network traffic under different quality settings.
Hypothesis Testing
From the previous analysis, the distribution of power consumption and network packages are not from the normal distribution. The distributions are similar in both Block One(YouTube) and Block Two(Twitch). We apply the non-parametric test based on our experiment design for both Blocks. For the test selection, since the dependent variables(energy consumption and network traffic) are tested in different situations with different levels of qualities, we use the Kruskal-Wallis non-parametric tests since they fit most in this test.
- YouTube
YouTube provide four quality setting options: 360p, 480p, 720p 1080p. We set energy consumption and network traffic data with these different quality options as input in the test. By setting 1080p as value 3 and 360p as 1, we got the p-value of energy consumption and for network packets are both less than 2.2e-16, which reject our null hypothesis, indicating that energy consumption and network packets are different under different quality settings in block one.
- Twitch
We use the four quality setting options that Twitch provides: 360p, 480p, 720p 1080p. Similar to Block One with YouTube, the experimental structure and the levels of quality are the same. So we apply the Kruskal-Wallis non-parametric tests on the energy consumption and network packages for Twitch. Using the same numeric transformation as block one. By setting 1080p as value 3 and 360p as 1, we got a p-value of 6.154e-16 for energy consumption and 7.219e-14 for network packets, so that null hypothesis is rejected, indicating that energy consumption and network packets are different under different quality settings in block two.
Effect Size Estimation
We investigate the effect size by using Cliff’s delta measure. We found an effect size of -0.83 and -0.99, for all the different video qualities in the energy consumption and network from YouTube and Twitch. According to Vargha and Delaney (2000) the value of the effect size can be interpreted as small, >= 0.11, medium, >= 0.28, large, >= 0.43. Since our effect size is -0.83 and -0.99, this means we have a large effect size, because the values are in inverse.
Discussion
Our experiment’s target is mainly for the users to know the impacts of quality settings on energy consumption and network traffic. Below is some information that helps users to choose quality settings.
The gaps among the quality settings
The trend shows that video playing under higher quality settings has more impact on the energy and network. The result means it cost more when users switch from 720p to 1080p than switch from 360p to 720p.
Pre-loading
The network traffic remains roughly the same during video playing time. The preloading algorithm of Twitch and YouTube might be the reason for having heavy network traffic when frequently changing videos.
YouTube advertisements’ pop-out
In this experiment, we do not subscribe to any paid services. The advertisements become unstoppable according to the algorithm of the applications. However, we can see specific pop-out advertisements that YouTube plays do not show in the low-quality settings(at 360p or lower). This fits the service in the YouTube interface as the “saving mode”.
Conclusion
We conducted an experiment that studies the impact of the quality settings on energy consumption and network traffic. To sample the wide choice of streaming applications, we choose YouTube and Twitch. These two apps are widely-used and mature in development. The experiment is organized into separate blocks since the comparisons can be tricky with their different features. After the experiments and data analysis, we can conclude that the quality of the videos indeed impacts energy consumption and network traffic. For both YouTube and Twitch we have shown statistically that higher quality options have higher energy consumption and lower quality options have lower energy consumption. For both apps higher quality options consumed more network traffic while lower quality options used less network traffic. For the extension of our experiments, a larger size of samples would be the next level of this experiment. Since we only got two blocks with two applications, the size of the applications narrows down the acceptance and generalization of our conclusions. We also discovered the interesting part about the pre-loading algorithm in streaming applications. The different pre-loading methods can also impact the energy consumption and network traffic of the devices.
By Kaixi Ma, Kristian Verduin, Gabor Banyai, Brian Lochan and Yunan Lyu