This article is a heavily abbreviated version of the following thesis. For more information, please refer to it.
Data and source code for verifying/replicating the study are available in this GitHub repository.
Reading time: 16 minutes
Introduction
Awareness towards the threat of climate change has increased in the in the last years. Sustainability, a practice concerned with the recognition of the finite nature of resources, and their conscious usage with regards to future generations has also experienced a similar growth in recognition. As a result of this, there has been a large amount of CO2-related scientific publications in the past years. CO2 emissions have risen rapidly for more than a hundred years. Greenhouse gases, especially carbon dioxide (CO2) emissions, are viewed as one of the main reasons of climate change, and it has slowly become one of the most important environmental problems for our world. In the early 1900s there have been estimated to have been around 1000 MMT of carbon dioxide. In the 2010s these numbers reached almost 10,000 MMT. This has been driven by a variety of factors: increased globalization, fossil fuel usage, population increase and more. Along with a surge in climate change related concerns, there has also been a growth in global Internet data traffic. In the year 2020 alone web traffic exchange has expanded with an average of 35% in size and has been previously predicted to experience further expansion with close to five and a half billion internet users expected by 2023.
As personal devices become more and more of a central point in human lives, the Internet usage grows rapidly as well. 92% of internet users nowadays access the web with mobile phones. Because of this, the amount of site hits grows larger with each year and that, in turn, affects the overall data consumption as well. Data centers are the backbone of the internet. They consume around 1-1.5% of global electricity use which translates to an estimated use of around 200-250 TWh of electricity per year with some estimates going as high as 400 TWh. A report by the International Energy Agency (IEA) from 2014 stated that the development of energy efficiency metrics was one of three key considerations needed for effective policy making and a reduction of the networks’ energy usage and in turn, the carbon dioxide footprint.
There has been research made about the IT sector’s emission generation but despite the importance of ICT and the ubiquity of the Internet, none of them have attempted to analyze the web’s CO2 footprint. Here, an attempt will be made to create a clear overview of some of the web’s most popular websites and the amount of carbon dioxide they are potentially generating.
To do so, the following question will be addressed:
‘What is the current state of energy consumption of the top Web sites in the world?’
Methodology
The data analysis is be strictly quantitative. The goal is to analyze the impact of the internet surfing habits on a relatively large scale and to compare an innocuous habit with the real-world impact it has. Due to the nature of the service that the data is sourced from, the analysis is done entirely on the homepage of a given website and because of that there is no focus on analysis of common types of data transfer like streaming video from a particular streaming service, loading multiple pages from the same website or infinitely scrolling pages (e.g., Twitter, Facebook, NBCNews.com). The main dataset used for analysis has been collected by using the Website Carbon API. It is an online tool created by Wholegrain Digital that provides an estimate for the ecological footprint of a website. The dataset where all the statistics have been collected was generated from the information calculated by the aforementioned API. It contains information about the 50,034 most popular websites on the internet.
The website list used has been sourced from the Tranco list of 1 million most popular websites. This is a list which uses averaged data from four other ranking providers (Alexa, Cisco Umbrella, Majestic and Quantcast). The data has been sourced from the four rankings and then averaged over a thirty-day period. The list used to in the process of writing the thesis was retrieved on 03/05/2022. The dataset that is used for analysis has been sourced between the period of 04/05/2022 and 21/5/2022.
Data Analysis & Results
Overview
Dataset Distribution
To provide a sound picture of websites and their CO2 emission impact, more than 65 thousand websites are explored. All are sourced from the original Tranco list and there are no other distinctions done to the website’s importance during the data collection process other than its ranking in the list.
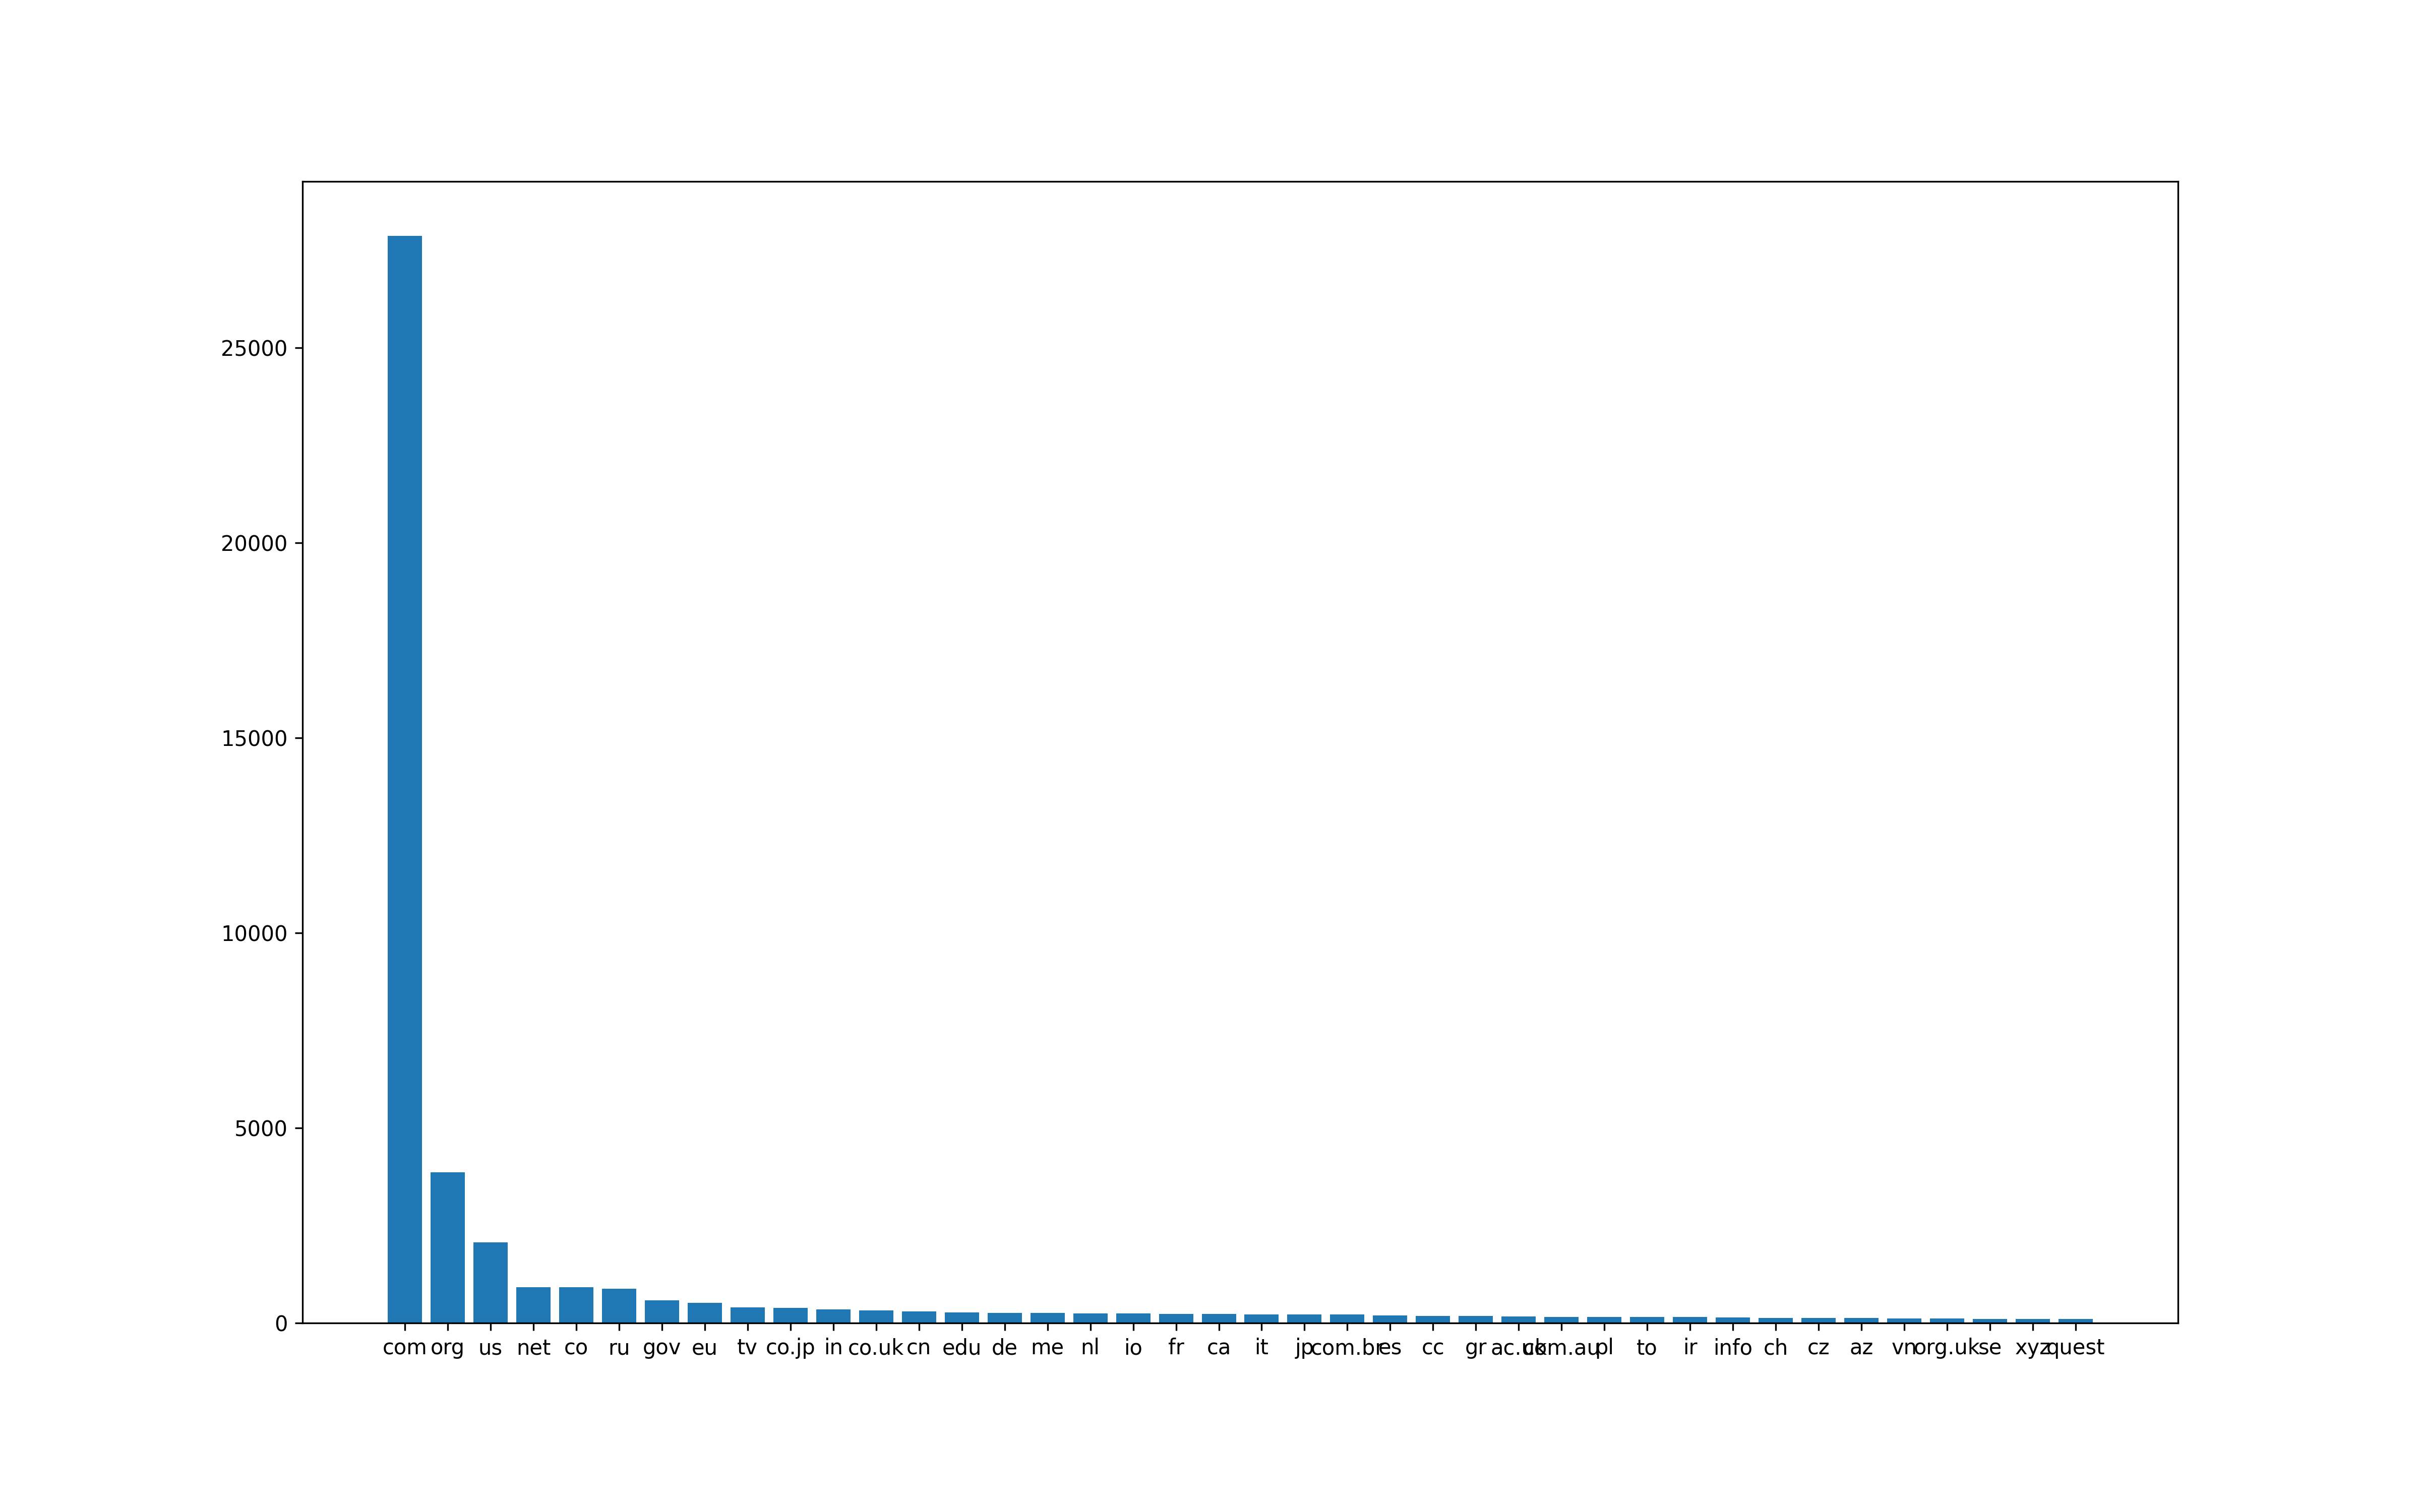
Top-Level Domains: There are 50,034 usable websites in the final dataset. From those, 27,873 have the “.com” top-level domain, 3868 have “.org “, and 2065 have “.net “ as the domain. Overall, there are 716 different top-level domains. The distribution is heavily skewed towards the first 3 TLD’s which account for 67.5% of the entire dataset.
Website Sizes: A website’s size might affect the time it will take to load it and the amount of CO2 it will generate. The collected websites vary greatly in range. Looking at the size on an initial load, the smallest measured domain response weights at exactly 168 bytes and the largest one is lematin.ma at 304MB. These are only outliers though as the mean size is only 3.69MB and the less affected by outliers median stands at 2.23MB. Overall, all the websites take 184.93GB of space.
CO2 Distribution
In total, the sites generate 46554 grams/25893 liters of CO2 and on average, a single site generates 0.562 grams of CO2 per first page load. The minimum amount registered is 0.000042 but the largest one is much bigger, at 76 grams per load. The mean and median numbers here are 0.9304637 grams/0.5175239 liters and 0.5629283 grams/0.3131007 liters. As a quick comparison we can use the estimated average per vehicle per year, which stands at 4600 kilograms. We can see that the dataset’s footprint is as much of that of 10 vehicles, if every website were to be accessed exactly once.
Energy
All sites use up 105 KWg of electricity, the biggest one uses 0.17 KWG and the smallest one 0.00000009568445 KWG. The mean and median figures are 0.002105122 and 0.001273593 respectively. That is a 99 and 99.993% difference when compared to the one using up the most. As a comparison, the average monthly US household consumption is 893 kilowatt hours per month. This measurement and the kilowatt hour per gigabyte one used here are not strictly equivalent but even then we can clearly see a rough estimate of the usage as compared to actual real world usage. This, and the dioxide usage will be discussed in more detail in the upcoming sections.
Green Hosting
The websites are classified as either True, for sites registering as being hosted ‘Green’ or Unknown for those which status could not be determined. Here we see that there are less websites classified as using green hosting than regular grid. The green websites take up 80.8GB of space against 104.06GB for the standard ones and the other three statistics follow a similar pattern: 20 kilograms of CO2 are generated for all energy efficient sites against 26 kilograms for the ones labelled “unknown”.
| Green Hosting | Bytes | Statistics: Energy (KWG) | Statistics: Grams of CO2 (Grid) | Statistics: Liters of CO2 (Grid) |
|---|---|---|---|---|
| Unknown | 104068160248 | 59.272054 | 26198.247878 | 14571.46547 |
| True | 80863090299 | 46.055599 | 20356.574757 | 11322.32688 |
Top and Bottom 1000
Here we observe similar numbers to those of the entire dataset. The top 1000’s average sizes are only slightly lower than the entire dataset’s and the same goes for the bottom. Overall, the differences are negligible with the top 1000 being only slightly lower (0.09mb) in terms of size than the 3.69 mb originally measured and the bottom is 0.14mb less. Those differences can be explained as small deviations caused by the presence or lack thereof of one of the previously detected outliers in this slice of the data, and that can be further seen in the bigger difference in the median sizes where there is a 0.4mb disparity. As far as the CO2 output goes, we also see a similar picture, as the averages stand at 0.90 and 0.86.
| Type | Top, MB. | Bottom, MB. | Top, Energy | Bottom, E. | Top, Grams | Bottom, G. |
|---|---|---|---|---|---|---|
| Count | 3600.20 | 3435.57 | 2.05 | 1.96 | 906.32 | 864.88 |
| Mean | 3.60 | 3.43 | 0.002050 | 0.002 | 0.906 | 0.865 |
| Median | 2.40 | 2.00 | 0.001364 | 0.001 | 0.603 | 0.503 |
Hosting Type
As previously noted, we have used two different definitions for the hosting type, True and Unknown. For the entire set we have approximately the same number of sites for both types, 25708 unknowns and 24326 greens, the difference is only 6%. The following table provides a detailed description on the distribution of sites based on the type of hosting and their size. Here we only look at sites larger than 10mb, which can all be called “outliers”.
| Type | >= 100mb | >= 50mb | >= 25mb | >= 15mb | >= 10mb |
|---|---|---|---|---|---|
| True Bytes | 897840743 | 4082672748 | 9812265588 | 18259742599 | 27146551273 |
| Unknown B. | 777391624 | 4024409192 | 11584901699 | 22420267851 | 35320806777 |
| True Count | 5 | 53 | 222 | 672 | 1407 |
| Unknown C. | 5 | 53 | 285 | 867 | 1935 |
| True, per site | 179,568,148.6 | 77,031,561.28 | 44,199,394.54 | 27,172,236.01 | 19,293,924.14 |
| Unknown, p.s. | 155,478,324.8 | 75,932,248.90 | 40,648,777.89 | 25,859,593.83 | 18,253,646.91 |
What we see is that a significant amount of the dataset is an outlier and that websites using regular energy are quite a bit more likely (28%) to be demanding and to have a larger emission footprint.
Per Domain
Original Domains
The seven “original top-level domains” were created in the 1980s to cover the needs of the first websites on the internet. They are: .com, .edu, .gov, .int, .mil, .net, and .org. Between these seven we have 35161 websites for a total of 130604115266 bytes/130gb. The distribution is shown in the table below.
| TLD | Amount |
|---|---|
| .com | 27884 |
| .org | 3873 |
| .net | 2066 |
| .edu | 921 |
| .gov | 387 |
| .int | 24 |
| .mil | 5 |
Applying the same type of analysis as before we see that the averages and medians are not too different than the entire dataset as they stand at 3.71/2.25mb. When comparing the domains directly we see a slightly different picture.
| Type | .com | .org | .net | .edu | .gov | .int | .mil |
|---|---|---|---|---|---|---|---|
| MB’s | 103289.11 | 13521.25 | 5951.96 | 6342.36 | 1351.43 | 111.69 | 36.30 |
| Mean MB. | 3.70 | 3.49 | 2.88 | 6.89 | 3.49 | 4.65 | 7.26 |
| Median MB. | 2.26 | 2.13 | 1.44 | 4.84 | 2.40 | 3.29 | 3.63 |
| Energy | 58.83 | 7.70 | 3.38 | 3.61 | 0.77 | 0.06 | 0.02 |
| Mean E. | 0.002110 | 0.001988 | 0.001641 | 0.003922 | 0.001989 | 0.002651 | 0.004135 |
| Median E. | 0.001290 | 0.001216 | 0.000825 | 0.002757 | 0.001366 | 0.001873 | 0.002071 |
| Grams | 26002.13 | 3403.85 | 1498.35 | 1596.63 | 340.21 | 28.12 | 9.14 |
| Mean G. | 0.93 | 0.88 | 0.72 | 1.73 | 0.88 | 1.17 | 1.83 |
| Median G. | 0.57 | 0.54 | 0.36 | 1.22 | 0.60 | 0.83 | 0.92 |
What this tells us is that most TLD’s follow the set averages, with the exceptions being .edu, .int and .mil. Those four are smaller than the entirety of .com but they do contain a significant number of weighty sites. For the energy consumption values and grams, we see repetitions comparable to the ones in “Bytes”. “Edu”, “Int and “Mil” are expectedly higher than the rest. Those domains are less than 2% of the entire dataset though and they do not have a major impact on the overall footprint. The full overview can be seen in the table above.
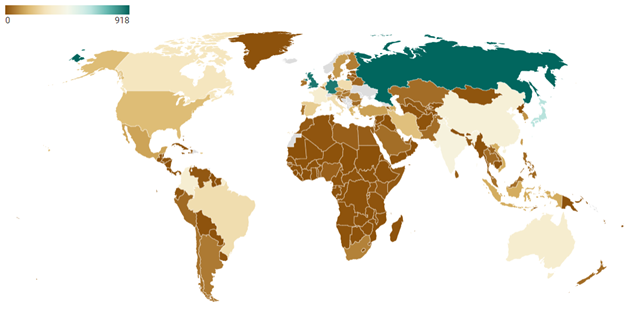
Regional Domains
Here follows a brief analysis on the regional domains found in the dataset. Those are all country specific domains that could be detected with regular expressions (e.g., “.co.uk” for the United Kingdom and “.bg” for Bulgaria”). They are not grouped by the location of the hosting server or the actual origin of the website as the latter is impossible to determine for all websites and the former can be considered meaningless as many websites nowadays are hosted in countries other than the one they are targeted for. This section analyses 10,180 domains, or 20.3% of the dataset.
| Region | EU + UK | North America | South America | Asia | Middle East | Oceania | Africa |
|---|---|---|---|---|---|---|---|
| MBs | 14441.05 | 2466.47 | 3473.42 | 16320.58 | 2234.84 | 1474.78 | 1346.97 |
| Mean MB | 3.27 | 3.64 | 4.11 | 4.71 | 4.56 | 3.65 | 4.60 |
| Median MB | 2.23 | 2.42 | 2.69 | 2.99 | 2.83 | 2.97 | 2.16 |
| Energy (KWG) | 8.22 | 1.39 | 1.98 | 9.29 | 1.27 | 0.84 | 0.76 |
| Mean E. | 0.001862 | 0.002072 | 0.002338 | 0.002681 | 0.002597 | 0.002079 | 0.002618 |
| Median E. | 0.001268 | 0.001 | 0.001531 | 0.001705 | 0.001612 | 0.001693 | 0.001231 |
| Grams | 3635.40 | 615.88 | 874.40 | 4108.56 | 562.60 | 371.26 | 339.089 |
| Mean G. | 0.82 | 0.92 | 1.03 | 1.18 | 1.15 | 0.92 | 1.15 |
| Median G. | 0.56 | 0.61 | 0.68 | 0.75 | 0.71 | 0.75 | 0.54 |
The two biggest groups here are the European and Asian domains. They represent 74.4% of the 10,586 regional websites and as such also generate the most dioxide. The European domains are smallest in size and the Asian + Oceanic ones are 26% larger. All regions exhibit large disparities between the mean and medians of all three categories of data (MBs, Energy, Grams) which of course indicates the presence of significantly sized outliers but the medians for energy and grams show that the African domains are the most efficient with 0.54g, followed closely by the European ones with 0.56.
| Region | Amount |
|---|---|
| EU + UK | 4416 |
| North America | 671 |
| South America | 846 |
| Asia | 3466 |
| Middle East | 490 |
| Oceania | 404 |
| Africa | 293 |
| Total | 10586 |
Discussion & Results
In order to truly understand this data though and see the impact a website has on the environment it is necessary to know how it compares to real world examples. To do so the data will be now compared against measurements sourced from the International Energy Agency. Then we will look at a small sample from the dataset and discuss possible improvements for web development.
The average emissions per capita vary greatly. IEA measures the footprint for a United States citizen to have been 14.4 tCO2. This number is very different than the average for Europe, which is 5.5 tCO2 or the one for Africa (1.0 tCO2). For this reason, the world average will be used here – 4.4 tons per person, per year, or 12kg per day.
We saw many different measurements in the analysis so far. As a whole, the data variability is high, with highs more than 1.8 million times larger than the lowest recorded value but depending on what the determined threshold for defining outlying data is, the variability stabilizes with a significant amount as the standard deviation can go from anywhere between 5.84 to 2.16 depending on which of the three outlier thresholds shown in “Outliers” are used.
That is to say though, those small in the scope of the article changes can have a very significant impact at a large scale. As we saw before, the average site size generates 0.93 grams of dioxide per page click and uses 0.002105 KWG of electricity. Loading all 50 thousand at once is equivalent to 46.5 kilograms, almost as much a single person does for 4 days. But that is only the average and with the already seen regional and per-domain differences this presents a real and significant danger.
A website can have anywhere between 1 and billions of clicks per month and 20 of the most popular websites on the internet alone generate over 100 billion visits per month. Going by these statistics alone, the internet’s impact is clearly massive as those twenty domains alone amount to over 93,000 tons per month, if every click was viewed as a first visit and we only used the previously mentioned average.
Those numbers can change significantly. If we apply the generally seen 25% reduction in data transfer by using caching on repeated visits then we get at a minimum 69,750 tons p/m or 837,000 per year and 105.33 kilowatts per gigabyte. If the 4.4 tCO2 per person, per year mentioned earlier are accurate then this means that the twenty most popular websites emit at least as much as 190,000 people, roughly the same size as the city of Breda, NL and use more than 130 billion kilowatts per gigabyte.
Another possible way to look at this would be to utilize the regional measurements and parse the information in a more fine-grained way. As stated before, the small changes per region are in reality significant at a large scale. The carbon footprint per continent ranged anywhere between 0.82 and 1.26 grams of CO2 per click, which in theory could lead to a 11% decrease/33% increase in emissions when visiting those sites, without accounting for caching.
Nevertheless, that ignores the bigger problem: the difficult to measure user behavior. There are at least 1.88 billion websites in the world and if each of these were opened just once per day then we’d be contributing negatively to the environment with at least 1748 tons of dioxide each day (again, if the estimated average is used for these calculations), more than 52 thousand each month and 638,000 each year (478,000 if adjusted for caching). If a user then visits 50 pages per day we might be looking at least at 32 million tons per year (23.9 million adjusted) which is as much as the population of a country of 7 million people could emit in a year by themselves.
Unfortunately, there is no realistic way to know that with precision as user behavior across the planet can be affected by many different reasons, ranging from the time of day to the type of the website or by local events or unpredictable natural phenomena.
Conclusion
The research question was defined previously as:
‘What is the current state of energy consumption of Web sites?’
While many web pages are often well optimized for speed and weight, it is not all of them. This article presented a simplified look at the state of some of the most popular websites on the web, an often-overlooked part of the existence of the internet. The domains were analyzed both in terms of how weighty and harmful they can be but also in how much of an impact they have on the electricity grid.
We found that the web can be unpredictable. Depending on the criterion used to determine large websites we can define anywhere between 7 and 30% of the analyzed data to be an outlier, and a significant amount of those excluded websites are multiple times larger than the norm. Generally, large differences in the footprint can be found between different regions, domain types and also between different parts of the dataset. The type of hosting is a major sign that a website can be sustainably built, as the Green labeled datacenters were hosting domains which were around 20% smaller on average than the rest.
Although in multiple sections the differences could be considered small at first read, they carry a large impact when scaled up. A gap of 5 to 20% or more can be considered unimportant for a single page load but it is of a much larger importance when that percentage can amount to thousands of tons of dioxide per day. As a webpage’s size increases, so does its energy usage, and an unoptimized page can easily lead to unneeded kilowatts of electricity that could have been used for a more important reason.
The emissions left on the planet accumulate daily and the only way to counter that is to work actively on reducing them. The slice of the web that was analyzed here is in a far from perfect state. Nearly a fifth of the data was found to be overly large and as of today there is no entity or organization that deals with actively monitoring and controlling website sizes, there are only guidelines and recommendations. Because of that the responsibility here lies on web developers entirely.
The internet is of course much bigger than this analysis and the dataset that was examined is only a minor part of the whole picture, in reality it can be safely assumed that the real numbers are much higher than what was discussed here. The actual impact of the web is unfortunately impossible to measure within the time constraints given, but this is still a starting point for any additional and much more expansive analyses on the current state of the internet.
By Ivan Ivanov